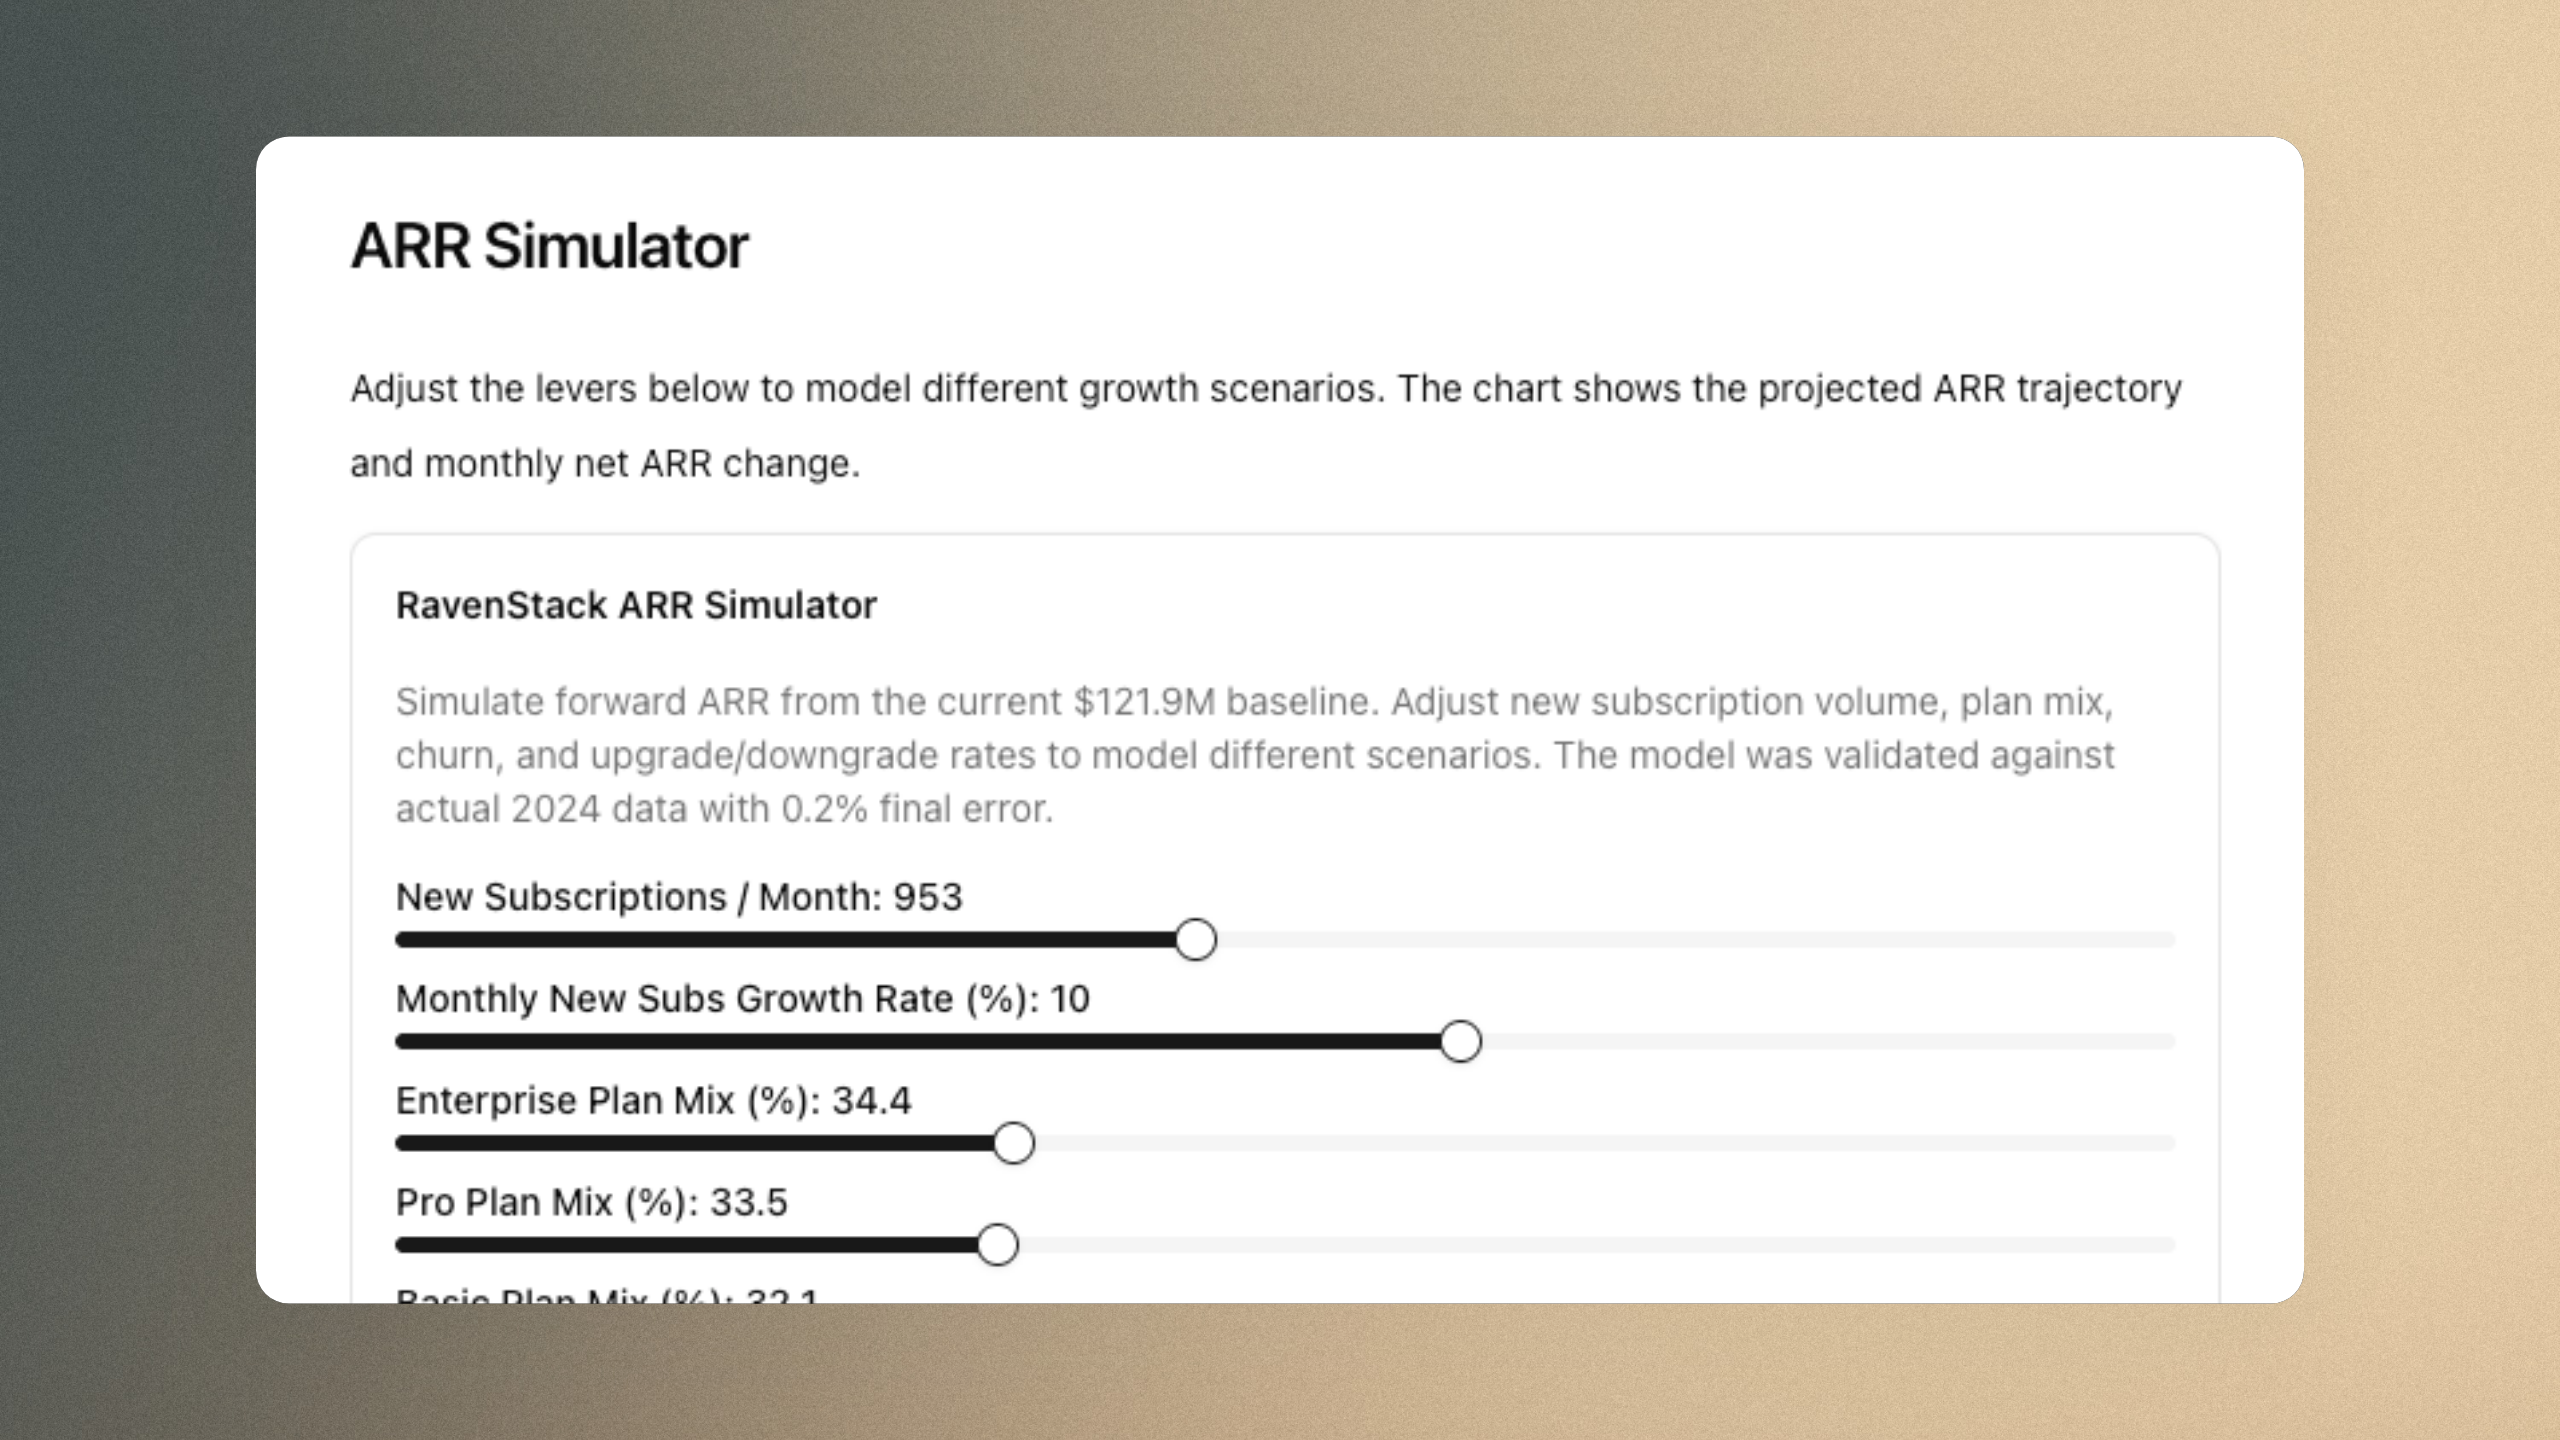
Reports That Run, Not Just Read
Phaide AI's Interactive Widgets turn a finished analysis into a working tool. When an AI agent completes its work — inside a Discover exploration or a chat analysis — it can embed a small, self-contained control panel directly in the report: a title, a short description of the logic, and a set of inputs such as sliders, dropdowns, number fields, toggles, and date pickers.
Behind each widget sits a Python function the agent has already written and run against your actual data inside a secure cloud sandbox. The report carries the controls; the sandbox keeps the logic. Adjust the inputs, press one button, and that function executes on demand, returning a fresh result inline. No code to write, no new prompt to compose, no waiting on the agent to think again. A report about your pricing becomes a pricing simulator. A report about churn becomes a what-if calculator.
Consider a margin analysis. Rather than stating a single figure, the agent can leave behind a profit simulator: a slider for unit price, a slider for advertising spend, and a function that combines them with the cost structure it observed in your data. You drag the sliders to the scenario your team is debating and read the projected profit immediately. The reasoning that produced the report stays intact — but now it is a calculator you control, not a conclusion you accept.
From One Answer to Every Scenario
A static report answers one version of a question. An Interactive Widget answers all of them.
Eight input types — text, number, slider, dropdown, toggle, date, time, and datetime — let you reshape a scenario and see the outcome immediately. Push the advertising budget up, drop the unit price, move the forecast date forward a quarter, and the result recalculates in seconds against the same data the analysis was built on.
The logic is not a black box. The agent is directed to describe the model in plain language and, for any predictive widget, to prove it first — showing validation data or error margins before the simulator appears in the report. If a forecast widget claims accuracy, the report shows the comparison that earns that claim, so you tune a model you can see the reasoning for, not a guess.
This closes a familiar gap. The questions a report raises rarely match the inputs it was run with: the figure that matters to finance is not the one marketing needs, and neither is fixed when the report is written. A widget removes the round trip. Instead of asking the agent again and waiting for a new analysis, you change the input that matters to you and get the answer in place — turning a one-shot deliverable into an instrument you return to.
The value compounds when work is shared. Widgets are scoped to your organization: anyone who can view a Discover report or a shared chat can run them. One analysis becomes a tool the whole team operates, each person testing the scenarios that matter to their own decision.
It is also durable. To conserve resources, the cloud sandbox behind a report is archived after a period of inactivity. Run a widget anyway and the sandbox is restored automatically — the simulator keeps working long after the analysis was written.
Three Steps to a What-If
Using an Interactive Widget takes no setup and no technical knowledge.
First, open Discover from the left sidebar and enter the theme you want to investigate — for example, "Analyze HR data and identify attrition factors." You can also choose how deep to go, from a quick pass to a comprehensive one. (Interactive Widgets appear in chat analysis sessions too, so the same capability is available wherever the agent reports back to you.) The agent then explores your data across multiple approaches in parallel and writes a report.
Second, read the report. Where a question invites experimentation — pricing, forecasting, capacity thresholds, scenario modeling — the agent embeds an Interactive Widget beneath the relevant finding, with its inputs already set to sensible defaults.
Third, set the inputs to the scenario you care about and click Run Simulation. The outcome appears under Result within seconds. Change the inputs and run again as often as you like. Share the report, and your colleagues can run the very same widget against the very same data.
That is the entire flow: explore, adjust, run. There is nothing to install, no environment to configure, and no query language to learn. The analysis hands you the controls and steps aside, ready to be operated by anyone on the team — from the analyst who commissioned it to the executive reading it a week later.
Stop Reading About Your Data. Start Asking It Questions.
Your next report should not end the conversation — it should start one. Open Discover, pose a question worth exploring, and let the analysis hand you a tool instead of a verdict. The best answer is the one you found yourself, by running the numbers your way.
FAQ
What kinds of inputs can a widget have? Eight types: free text, number fields, sliders, dropdown menus, on/off toggles, and date, time, and datetime pickers. Each one is configured by the agent with sensible defaults, ranges, and labels so it is ready to use the moment the report loads.
Do I need to know how to code? No. The agent writes and tests the underlying Python function for you. Your only job is to move the controls and read the result.
Where do Interactive Widgets appear? Inside the analysis reports generated by Discover (automatic exploration) and inside chat analysis sessions. Anywhere the agent decides a scenario is worth experimenting with, it can embed one.
Is the simulation trustworthy, or is it guessing? The agent is instructed to ground every predictive widget in evidence — describing its model and presenting validation data, such as a comparison of predictions against real values, before the widget appears. You can judge the reasoning before you rely on the result.
Can my teammates use a widget I received? Yes. Widgets are scoped to your organization, and anyone who can view the Discover report or shared chat that contains one can run it against the same data.
What happens if I come back to an old report and run a widget? The cloud sandbox that powers the widget is archived after a period of inactivity to save resources. When you run the widget, the system restores the sandbox automatically and executes your inputs, so older reports stay interactive.
Does running a widget change the report or my data? No. A widget executes a read-only calculation with the inputs you provide and returns a result. It does not alter the report, your underlying data, or the original analysis.